 Hoosiers by the Numbers
Assigning Occupations
The most significant gap with workforce administrative records was the lack of occupation codes for payroll employees. We had two goals: to persuade employers to add SOC codes to their wage records with their quarterly UI filing and to create models to use direct and indirect ways to assign occupations and to validate the employer-assigned codes, with what we now call the Occupation Assignment Engine. Here we describe how we successfully accomplished both goals.
Employer-assigned occupation titles (SOC)
The Indiana Department of Workforce Development modified the UI electronic filing system to request that payroll employers assign and submit occupation job titles with their wage records as part of their quarterly filings. By 2021, approximately 50% of Indiana employers are doing just that.

So how did we accomplish this?
Once the addition to the UI system was approved, we faced the hurdle of making it relatively easy for them to comply. We needed a mechanism for them to translate their internal job titles to the standardized job titles of the SOC. We reached out to the National Association of State Workforce Agencies (NASWA), which was able to provide us, through their partnership with the Unemployment Insurance Information Technology Support Center (UI ITSC) with a program called OccuCoder that was developed to match non-standardized job titles to SOC coded titles. The IBRC programmed a web wrapper and made the tool available via Hoosiers by the Numbers www.hoosierdata.in.gov/coder). Employers can easily look up a few job titles (if they have few employers) or copy and paste from a spreadsheet into the interactive grid we call “Do a Bunch” and save those to attach to their records. This tool became immediately popular and has been heavily used every quarter by our employers.
We engage directly with employers and also provide them with an FAQ document. As part of our WDQI work, we also produced a specially curated dashboard for those employers who provide the SOC’s with their wage records. We directly emailed those employers with a description and link to the dashboard (https://www.hoosierdata.in.gov/lmi-dashboard.asp). We received both positive feedback and the dashboard has had significant usage since its initial release.
Occupation Assignment Engine
Direct and Indirect Methodology
Why we built this
A lack of detailed, geographically granular occupation data has been a significant gap in labor market information for a long time. To bridge this gap, the Indiana Department of Workforce Development (DWD) and the Indiana Business Research Center (IBRC) at Indiana University’s Kelley School of Business worked together to improve the quality and integrity of workforce data as part of the U.S. Employment and Training Administration’s Workforce Data Quality Initiative.
Together, we have developed integrated models, namely Occupation Assignment Engine, to assign occupation codes to payroll employment records, using advanced statistical methods (aka machine learning). The Occupation Assignment Engine is a structured set of modeled processes of clustering job titles into broader structure to predict the SOC title and code to a particular job.
The classification of occupations are generally standardized based on skills, education, experience, or wages. We decided to use the U.S. Standard Occupational Classification (SOC), which have compatibility with the O*NET occupation database that includes information on skills, abilities, work activities, interests, knowledge and others.
Below, we provide an overview of the engine, describing specifically the input data used in models and the methods used that combined direct and indirect matching of job titles to SOC codes. More detailed documentation relating to the public licensing agency data, public employee data, and the OES microdata are available in the Knowledge Transfer section of the WDQI pages on Hoosiers by the Numbers.
Critical Input Data
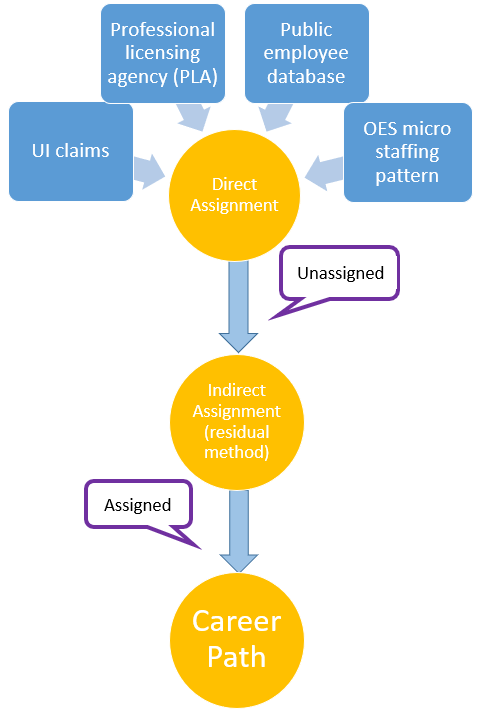
One of the most significant gaps in workforce records is that of occupation titles and codes. Reducing that gap allows the tracking of career pathways. The chart flow below illustrates how we can achieve this goal.
Figure 1: The Occupation Assignment Engine Workflow
Standard Occupational Classification
The Standard Occupational Classification (SOC) system is a federal level occupation categorization in the labor market. The SOC covers all jobs, including all sectors such as non-profit, private, and military. This categorization is organized in a hierarchical structure with four levels: 23 major groups (first tier), which are broken into 97 minor groups (second tier). Then, each minor group is further broken into 461 broad occupations (third tier), and finally the most specific level of 840 detailed occupations (fourth tier).
Table 1: SOC-2010 Major Group Categories
| Major Group SOC Code | Occupation |
|---|---|
| 11-0000 | Management Occupations |
| 13-0000 | Business and Financial Operations Occupations |
| 15-0000 | Computer and Mathematical Occupations |
| 17-0000 | Architecture and Engineering Occupations |
| 19-0000 | Life, Physical, and Social Science Occupations |
| 21-0000 | Community and Social Service Occupations |
| 23-0000 | Legal Occupations |
| 25-0000 | Education, Training, and Library Occupations |
| 27-0000 | Arts, Design, Entertainment, Sports, and Media Occupations |
| 29-0000 | Healthcare Practitioners and Technical Occupations |
| 31-0000 | Healthcare Support Occupations |
| 33-0000 | Protective Service Occupations |
| 35-0000 | Food Preparation and Serving Related Occupations |
| 37-0000 | Building and Grounds Cleaning and Maintenance Occupations |
| 39-0000 | Personal Care and Service Occupations |
| 41-0000 | Sales and Related Occupations |
| 43-0000 | Office and Administrative Support Occupations |
| 45-0000 | Farming, Fishing, and Forestry Occupations |
| 47-0000 | Construction and Extraction Occupations |
| 49-0000 | Installation, Maintenance, and Repair Occupations |
| 51-0000 | Production Occupations |
| 53-0000 | Transportation and Material Moving Occupations |
| 55-0000 | Military Specific Occupations |
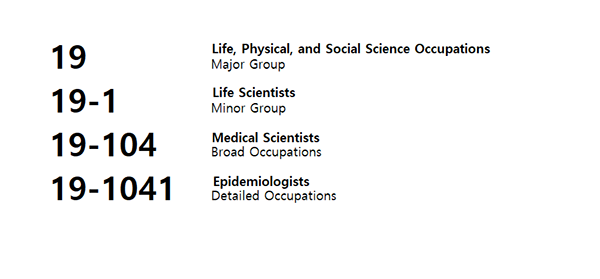
Figure 2 identifies how the SOC is structured in six-digit code. First tier are “Life, Physical, and Social Science Occupations,” 19-0000, second tier are “Life Scientists,” 19-1000. Medical Scientists are the third tier, 19-1040, and finally epidemiologists are the fourth tier, 19-1041. As one notices, the most detailed occupation description is the fourth tier.
Figure 2: The SOC Six-Digit Structure
Occupational Employment Statistics Survey Data
The Occupational Employment Statistics (OES) survey estimates employment and wages for more than 800 occupations in nonfarm establishments on the nation, state, metropolitan, and industry level. In addition to the occupation level, the OES program produces wage estimates for about 415 industry classifications at the national level, which corresponds to the North American Industry Classification System (NAICS). The scope of the survey includes NAICS industries on 3-digit, most 4-digit, and selected 5- and 6-digit levels. The NAICS code structure is similar to that of the SOC code. Table 2 and Figure 2 explain the general configuration. The survey is a federal-state collaborative program to help researchers and practitioners understand the employment structure of American labor market. The uses of OES data includes analyses of wages, employment, occupational projections, skills, technology, market, and many more.
Table 2: NAICS 2-digit level
| Code | Industry Title |
|---|---|
| 11 | Agriculture, Forestry, Fishing and Hunting |
| 21 | Mining, Quarrying, and Oil and Gas Extraction |
| 22 | Utilities |
| 23 | Construction |
| 31-33 | Manufacturing |
| 42 | Wholesale trade |
| 44-45 | Retail trade |
| 48-49 | Transportation and warehousing |
| 51 | Information |
| 52 | Finance and insurance |
| 53 | Real estate and rental and leasing |
| 54 | Professional, scientific, and technical services |
| 55 | Management of companies and enterprises |
| 56 | Administrative and support and waste management and remediation services |
| 61 | Educational services |
| 62 | Healthcare and social assistance |
| 71 | Arts, entertainment, and recreation |
| 72 | Accommodation and food services |
| 81 | Other services (except federal, state, and local Government) |
| 99 | Federal, state, and local government (OES designation) |
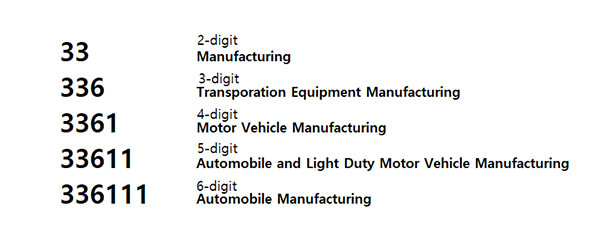
Similar to the SOC hierarchical structure, NAICS uses a 6-digit coding system to categorize industries. As seen in Figure 3, the first two digits designate the industry sector, the third designates the subsector, the fourth digit designates the industry group, fifth digit designates the NAICS industry, and the sixth digit represents the national industry. If the code ends with a zero as the sixth digit, that indicates the NAICS industry and the U.S. industry are the same. In total, there are 1,057 industries in the United States.
Figure 3: NAICS Digit Structure
Public Employee Data
Public employee records have been publicly available in Indiana since 1943 (Form 100R). Starting in 2013, Indiana government units must submit their public employee records and enter them through the Indiana Gateway (Gateway). Gateway is a public data hub where researchers and taxpayers can use as a tool for their own purposes. The report is submitted by the government unit fiscal officer, and requires government units to indicate health care plan, retirement pension, geographies, demography, wages, and so on for each employee. Specifics include such as:
- Year
- Name
- Business address (city, state, zip code)
- Job title
- Total compensation
- Department name and unit type
Public Licensing Agency Data
The Indiana Professional Licensing Agency (PLA) maintains a public database and online portal of individuals that have been granted a license or certificate required for an occupation within the state of Indiana. The public is allowed to access the following information for each license:
- Name
- License number
- Address
- Issue date
- Expiration date
- License status (Active, Cancelled, Expired, Pending, Probation, Superseded, Suspended, etc.)
- Date the license status was updated
The Indiana Workforce Intelligence System
The Indiana Workforce Intelligence System (IWIS) is a system generated by the Indiana Department of Workforce Development (DWD) that has vast individual record level information. The system is a unique collaboration of the state agencies and university researchers to integrate student and worker data. This data is used to better analyze outcomes of different topics associated with Hoosiers. The data includes not only administrative data, but also higher education enrollment and graduation records, employment and unemployment insurance (UI) wage records, UI benefit claims records, claimant demographics, geographic and demographic details from different agencies.
Methodology
In this section, we present the methodology we used to assign SOC codes in various agencies’ data, whose SOC codes will be eventually passed to IWIS’s employee wage records. There are two types of methods we used, which we name the direct and indirect assignment.
A) Direct Method
For direct assignment, we used a combination of directly linking through SQL query using IBRC in-house crosswalk files, and manual coding. The application of method differs with each data source. In this section, we give an overview on how we handled the task.
A.1) Public Employee Jobs Analysis
Public Employee Jobs Analysis is a process and model that uses a direct match method to link publicly available job titles to appropriate SOC codes, on the 6-digit level, or detailed occupation. The analysis first got started in collaboration between IBRC and DWD, with an intention of exploring state and government jobs. Together, they designed a crosswalk to categorize different job titles into SOC codes to facilitate analysis.
The Public Employee data (Form 100R) introduces many obstacles when dealing with job titles. Often, there are misspellings, non-existent titles, abbreviations that do not match SOC codes. To combat this challenge, IBRC and DWD created a crosswalk between the records and SOC codes using two direct matching methods: computer programming and manual matching.
IBRC has its own SOC crosswalk composed of unit type, department, job title and SOC codes. These are the possible job titles linked to the appropriate SOC codes that IBRC has in its database. The data is useful in the direct match process for the public employee data, before doing the direct manual matching. Using any computer programming language such as SQL, RStudio, Stata, we matched the public records to the crosswalk database by job title, department, and unit type. This way, manual coding will be less costly.
After running the model, we identified records that required updating. If occupations seemed unclear or unknown, we manually searched the O*Net Code Connector to find appropriate SOC code.
A.2) Occupational Employee Statistics Microdata
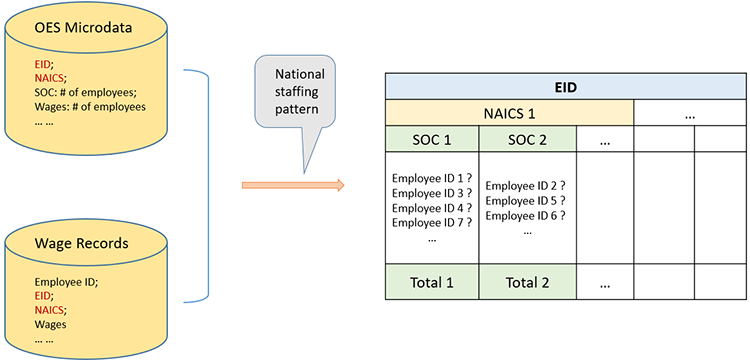
The OES Microdata assignment project is designed to use the OES employer’s survey microdata from BLS and link SOC codes to DWD IWIS’ wage records with available information given in the two databases. This assignment system adds an additional scope to the SOC assignment as it provides more information in the private sector. The SOC code linkage between OES data and IWIS’ wage records can be partially established by employer’s Unemployment Insurance (UI) account number and 6-digit level NAICS code.
This match assignment is described in Figure 4. A wage record with a match to the OES data (via EID and NAICS codes) would have a list of narrowed-down SOC codes from its employer, and a potential SOC code was assigned to the wage record based on its wage distribution. In the case of multiple SOC codes, we only kept the SOC code with the highest compensation.
Figure 4: OES and IWIS Direct Method Overview
A.3) Public Licensing Agency Data Assignment
This assignment utilizes two databases, the OES database and Indiana public licensing agency (PLA) database, two of which can be joined by UI identification. The process began with cleaning the PLA database. Many licensing boards that supply data to PLA have their own license status categories, therefore we developed a condensed and standard list of license status values based upon information available from the licensing boards. The standard list of status values was ranked in order of importance to indicate which license should be given priority in the occupation assignment process if there were several licenses held by the same individual. For example, the priority ranking will consider a Home Inspector License with an active status rank to be of a higher rank than a Real Estate Agent License with an expired status rank from the same individual.
The Indiana Department of Workforce Development supplied IBRC with a crosswalk that listed SOC codes associated with each type of license or certificate that is tracked in the PLA database. This crosswalk was then joined to the OES data for Indiana, which list the possible industries of employment for each standard occupation code. The join resulted in a crosswalk for each year that contained one record per license and SOC combination with the full list of possible industries of employment for each record. The staffing patterns were used for the most detailed level of NAICS industry codes available for the year in question. For data prior to 2010, the License to SOC crosswalk was changed to use 2000 SOC codes rather than 2010 SOC codes.
B) Indirect Method
Unlike the direct assignment, indirect method relies on certain given information in the starting database to assign the highest probable SOC codes to the finishing database. That certain information may be people’s wages, working industries, address, departments, and so on. While this indirect method may have caveats, when done successfully, it is a powerful tool to use for practitioners and researchers. We deployed this method to assign SOC codes to the wage records that cannot be manually assigned through direct method. Thus, we name it the imputation model. In this section, we will unfold the logic of the imputation method.
B.1) Imputation Model
After the direct match of various databases with the IWIS’ wage records, we were able to obtain the wage distribution of occupations given an industry. Since the matched cases do not cover entire spectrum of industries—for example, agricultural workers are not reported in the various agencies’ database we looked—we also incorporated the OES’s National Industry-Specific and by Ownership (that is, the national industry-occupation staffing pattern), a publicly available data, for the missing industries. The complete list of distribution of occupations from assigned records served as the NAICS-SOC staffing pattern for the unassigned records.
The imputation method proceeds as follows: First, within each NAICS code, we ranked the SOC codes from the most to the least popular, based on the NAICS-SOC staffing pattern; we also calculated the remaining population control for each SOC code by subtracting the number of assigned cases from the total headcount for that SOC code. Then, for each unassigned record we built a SOC profile, and ranked the SOC codes from the most to the least likely, based on the record’s wage distribution. After these preparation, we were ready for the “random assignment”, illustrated by Figure 5.
Given a NAICS code, start with the most popular SOC code, say A, randomly assign it to a pool of records, whose most likely SOC codes are A. If the headcount (population control) for SOC A exceeds the number of candidates in the first run—in other words, every record that has A as its first choice is assigned with A, we will continue to assign A to the pool of candidates, whose second choice is A. We continue with this process, until the number of assigned cases reaches the ceiling for A. Once A is assigned, following the same process, randomly assign SOC B to the remaining unassigned records; and then move on to assign C, D, … For records that did not get picked for current SOC, they will be moved to the pools of candidates for the assignment of other SOCs.
The random assignment was carried out as a top-down procedure: first, assign the two-digit SOC codes; then, under each two-digit SOC code, assign the 6-digit SOC codes. This helps control the “noise” (unrelated possibilities) in the procedure.
Figure 5: Random Assignment, Imputation Model
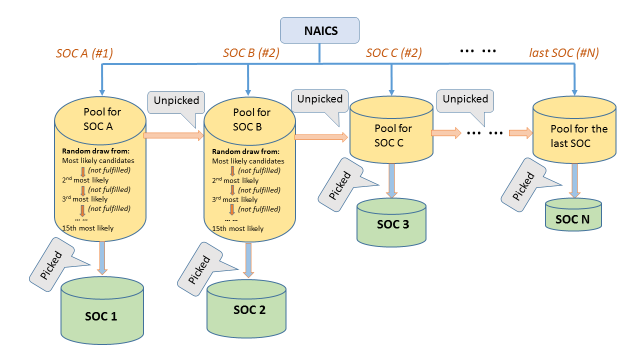
For example, healthcare practitioner is the leading sector in Indiana, so we would look at the distribution of SOC codes within this sector. Among all the SOC codes, we find that registered nurse is the leading occupation, followed by administrative staff. Thus, we start with registered nurse and randomly assign this SOC code to individual records whose most likely occupation is registered nurse, based on their wage distribution. If after the first run we haven’t assigned all registered nurses, we would continue to assign it to individual records whose second, most likely occupation is registered nurse. Once we have enough registered nurses—reaching the ceiling of headcount—we would move on to assign administrative staff to the remaining unassigned records.
Conclusion
Occupation coding can be costly if done manually. Without automatic computer-assisted coding assistance, one can find the process difficult to proceed. In this documentation we demonstrated a combination of human coding, computer-assisted manual coding, and partial match methods to produce the closest proximity to the standardized codes built upon various data sources.
From a workforce development point of view, the essential goal of occupation assignment engine is to build a pathway tool that allows users to interactively visualize likely career trajectories, within or across regions and industries, and to deploy the relevant resources, such as providing training courses or connecting with potential employers. Standardized coding is also practical in many settings for researchers.
In this documentation, we demonstrated the hybrid, modeled approach in assigning proper SOC codes to datasets that contain ambiguous job titles. We used computer assisted automatic coding assignment first to lessen the work of manual matching process. After the hybrid approach, we used the partial information match system to assign the closest SOC codes to the remaining observations. In the future, we would further explore the automatic coding process using additional methods such as Support Vector Machine, MaxEnt, and Bayes theorem.
Reference
- Indiana Gateway for Government, User Guide for 100R. https://gateway.ifionline.org/userguides/ 100Rguide
- O*NET OnLine. OnLine Overview. U.S. Department of Labor. https://www.onetonline.org/
- U.S. Bureau of Labor Statistics. Occupational Employment Statistics.https://www.bls.gov/oes/
- U.S. Census Bureau. North American Industry Classification System Manual. https://www. census.gov/eos/www/naics/2017NAICS/2017_NAICS_Manual.pdf
- U.S. Department of Labor. Standard Occupation Classification. http://www.bls.gov/soc/
Acknowledgments
This guide was prepared as a part of an ongoing collaboration with the Indiana Department of Workforce Development and the Indiana Business Research Center to provide guidance on using modeling and machine learning to assign occupation codes (SOC) to wage records. We are thankful to have this opportunity from the U.S. Employment and Training Administration as part of the Workforce Data Quality Initiative.
Suggested Citation
Indiana Business Research Center (2020). Occupation Assignment Engine: Direct and Indirect Methodology. Bloomington, IN: Indiana Business Research Center and the Indiana Department of Workforce Development.
Contact Information
For more information, contact the Indiana Business Research Center at [email protected].